It’s easy to get confused
when comparing dyno graphs because there are so many factors that affect the
dyno test results. Different brands and models of dynomometers, gear ratios, correction factors, engine and oil
temperatures, tire pressure, vehicle mounting procedures, dyno calibration,
clutch slippage, and the amount of engine break-in or wear can all affect the
test. The dyno operator has control over some of these variables and can have
as much as a 10% effect on the power output.
One of the most common differences
when conducting roll-on power tests on a dyno is in the gear used during the
test. Although fourth gear has been the “de facto standard”, some dyno operators
prefer to use fifth gear, and now 6th gear, which can distort comparisons. Power readings
recorded in fifth or sixth gear are generally higher than those performed in fourth
gear. Also, a final drive ratio such as 3.15:1 will often show a higher
power reading than a 3.37:1 ratio. Generally, the higher the transmission
gear, the greater the engine loading and higher the power
reading will be. Since the higher gear ratio slows the engine’s acceleration
rate, less power is required to accelerate the rotating and reciprocating parts.
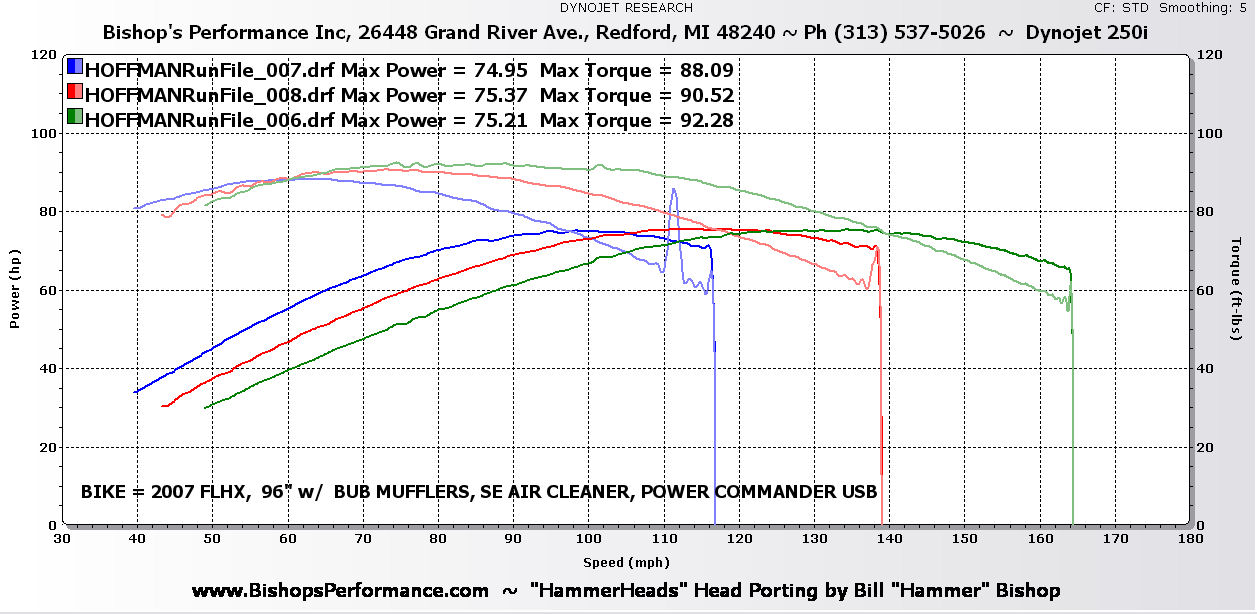
Another thing that the operator should keep in mind when choosing a gear is the
speed rating of the tires on the bike. It is possible for even a mild 96"
with a 6-speed to reach a calculated speed of 160 mph on the dyno, when the
factory tires are only rated to 130 mph. Lastly, some of the newer models
have a "speed-governor" which won't allow the bike to go over a certain mph, so
they may not be able to go up to an rpm high enough to show peak power in 6th
gear.
It's easy to get caught up in the chase for big numbers, so the most important thing to keep in mind is that a dyno is primarily a tool for tuning and diagnostics.
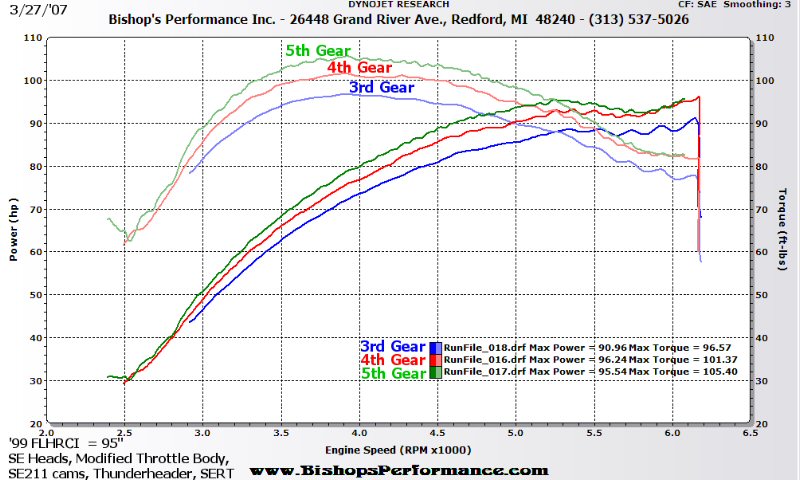
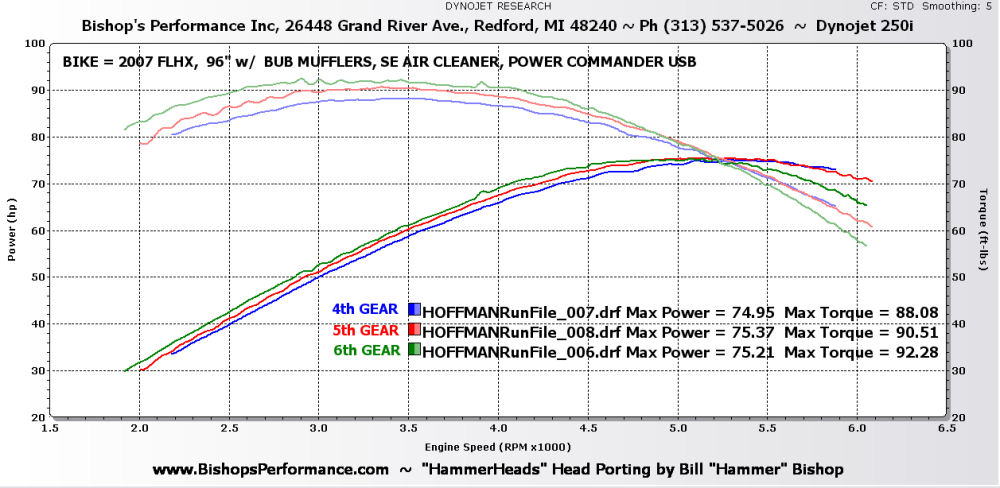
These graphs show the difference between 3rd, 4th, and 5th gear
in a bike with a 5-speed transmission,
and 4th, 5th, and 6th in a bike with a 6-speed
transmission. These are just examples and not all bikes will display the
same differences between gears.
| 5-speed (RPM) | 6-speed (RPM) | 6-speed (Speed) |
 |
 |
 |
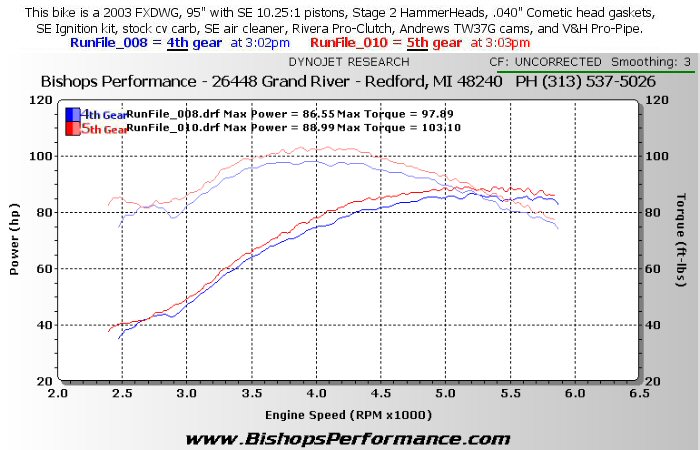
The 2 runs in the chart below were done on December
9, 2004 on a Dynojet Model 250i
The numbers in
RED = RunFile_008 at 3:02pm in
4th gear. The
numbers in Blue = RunFile_010
at 3:03pm in 5th gear.
The bike is a
5-speed 2003 FXDWG Dyna Wide Glide, 95" with SE hi-compression
cast pistons (10.25:1),
Cometic .040" head gaskets, SE ignition kit, Stage 2 HammerHeads, Andrews TW37G
cams,
SE air cleaner, stock/rejetted 40mm CV carb, V&H
Pro-Pipe, and Rivera Pro-Clutch.
| Graph | CF | Smoothing | Gear | HP | TQ | Gear | HP | TQ |
 |
SAE | 5 | 4th | 85.29 | 96.63 | 5th | 87.64 | 101.42 |
 |
SAE | 3 | 4th | 85.42 | 96.61 | 5th | 87.80 | 101.73 |
 |
SAE | 0 | 4th | 85.71 | 97.03 | 5th | 90.35 | 102.37 |
 |
Uncorrected | 3 | 4th | 86.55 | 97.89 | 5th | 88.99 | 103.10 |
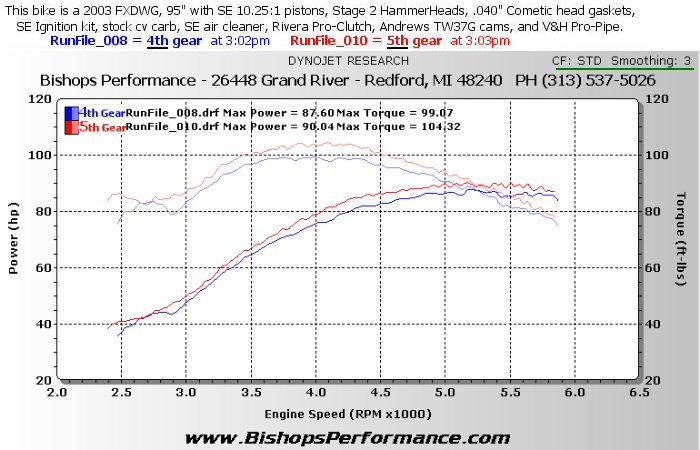 |
STD | 3 | 4th | 87.60 | 99.07 | 5th | 90.04 | 104.32 |
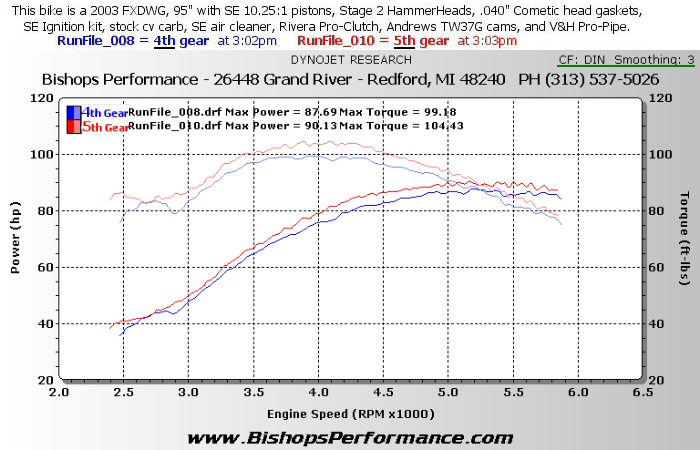 |
DIN | 3 | 4th | 87.69 | 99.18 | 5th | 90.13 | 104.43 |
 |
DIN | 0 | 4th | 87.99 | 99.61 | 5th | 92.75 | 105.09 |
You can see, a single bike can have peak horsepower from 85.29
to 92.75,
and peak torque from 96.63 to 105.09. That's a variance of nearly 10% !
And keep in mind that another dyno may produce
a totally different set numbers for the same bike.
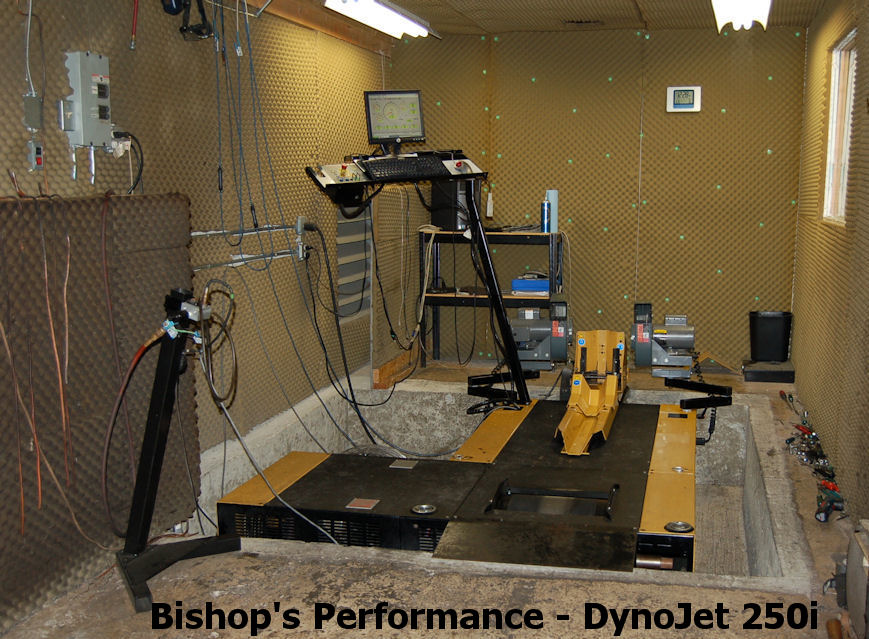

Many dynos are enclosed in a room or "cell", while others are located
in a large open room or even outside. For consistent, accurate results, a
dyno needs plenty of fresh air as well as some way to remove the contaminated
air. Exhaust contaminated air contains carbon monoxide which reduces the
oxygen content in the air. Just like us, our bikes need to breathe.
No oxygen = no power. If you go into a facility and can't see any apparent
air intake or exhaust system, beware. If you can smell the exhaust, the air is
contaminated and power will likely be down. Not to mention the affect on the poor dyno operator! Our cell is designed to exchange the air in the room
approximately 8 times per minute, ensuring that the air is always fresh and
clean. Fresh air enters the room from two 3' x 3' vents in the exterior
wall. Then, a 36" fan in the ceiling of the room draws the air up out the
roof.
Ideally, every dyno pull
would be done under identical atmospheric conditions. This is seldom the case,
so a power correction factor (CF) is applied to a measured power reading to
compensate for changes in barometric pressure, temperature, and humidity. Theoretically,
the
power CF helps make it possible to compare dyno runs performed at different
locations and under different atmospheric conditions, but it is not 100%
accurate. The most common correction factors used are STD (Standard), SAE (Society of
Automotive Engineers), and DIN (Deutsche Industrie Norm). Less common are
EEC, JIS, and Uncorrected. SAE uses less favorable atmospheric conditions
than STD or DIN, and it is the most frequently used for rear wheel testing,
however STD is becoming more common. Lower
correction factors also tend to be more accurate. It is important to remember
however that a CF is only intended to compensate for small atmospheric
differences and doesn’t correct for other factors, such as engine and oil
temperatures.
A detail that the dyno operator has complete control over is the
"smoothing" factor. This allows the operator to show more or less detail
in the lines on the graph. Our Dynojet 250i has a smoothing scale from 0
to 5, with 0 showing the most detail. More detail generally produces
higher output as the lines on the graph will show small spikes. If the
bike is tuned well, there will be a smaller difference between 0 and 5
smoothing. See the first 3 and last 2 rows in the above chart to compare the results
of different smoothing factors.
Due to frictional and windage losses, oil plays a
significant part in power readings. Cold oil will reduce power readings as
will excessively hot oil. Another little known fact is that the type
and weight of oil can affect the power as well. Pure synthetic oil can
easily show a 1% - 3% or greater increase in horsepower compared to
conventional petroleum based oil. Regular maintenance items, such as the
air filter and spark plugs can also affect performance. A clean air filter
and properly gapped and indexed
plugs make for a happier engine!
A rear wheel dyno takes into account the
efficiency of the bike's drivetrain, and some chassis and drivetrains perform
better than others. A slipping clutch, primary chain adjustment, final
drive belt adjustment, the rear tire's compound and air
pressure, and the manner in which the bike is tied down on the dyno can all
affect power output. Have you ever tried to push a bike with a flat tire?
Under inflated tires rob horsepower! Always check the tire pressure before
running a bike on the dyno.
Finally, the mileage and amount of
wear or break-in on an engine will also affect the performance. A well
broken-in engine will have less power-robbing frictional losses than a new
engine with relatively few miles on it. We've seen an increase of nearly
10% from power readings done at 1,000 miles to readings taken at 6,000 miles.
When we build an engine specifically for racing, it is assembled with greater
tolerances - in a sense it is pre-worn and designed for shorter lifespan and
more maintenance. It is almost at peak power right off the bench. In
regular daily-driven bikes however, you want them to last so they are assembled tighter
and allowed to slowly break-in.
Do you still want to know more? The following is from Dynojet's
"WinPEP7" software:
Theory of Operation
Dynojet’s inertia dynamometer is a measuring device for
recording and displaying power and
torque of an engine. Its method of measurement is a
direct implementation of the definitions of power and torque.
Correction factors assist in the comparison of
these measurements under various test conditions, making
computer hardware and software necessary to obtain, interpret, and
display the data.
Power
Power in mechanical terms is the
ability to accomplish a specified amount of work in a given amount of time. By
definition, one horsepower is equal to applying a 550 pound force through a
distance of 1 foot in one second. In real terms, it would take 1 HP to raise a
550 pound weight up 1 foot in 1 second. So to measure horsepower, we need to
know force (in pounds) and velocity (in feet per second).
Dynojet’s inertia dynamometer measures
power according to the terms just described. It measures velocity by measuring
the time it takes to rotate a heavy steel drum one turn. The
dyno measures force at the surface of the drum by indirectly
measuring its acceleration. Acceleration is simply the difference in velocity at
the surface of the drum from one revolution to the next. The force applied to
the drum is calculated from acceleration using Newton’s 2nd law, (F)orce
= (M)ass x (A)cceleration.
Power is coupled to the drum by
friction developed between the driving tire of the vehicle and the knurled steel
surface on the drum of the dynamometer.
Torque
When an object rotates around a point,
its speed of rotation depends on both an applied force and the moment arm. The
moment arm is the distance from the point of rotation to where the force is
being applied. Torque is the product of the force and the moment arm. For
example, if a rope, wrapped around a drum of 1 foot radius, is pulled with 550
pounds of force, the resulting force is 550 foot-pounds.
The Torque on the dyno’s drum can be
calculated by multiplying the force applied by the drum’s radius. However,
engine torque is not equal to drum torque because the gearing through the drive
train changes the moment arm. The change in the moment arm is proportional to
the ratio of engine speed to drum speed. Therefore, tachometer readings are
necessary to calculate and display engine torque.
Correction Factor
The calculation of horsepower or the
accuracy of our dynamometer is not dependent on the location or conditions
during the measurement. The performance of the internal combustion engine is,
however, sensitive to atmospheric conditions, especially air density and air
temperature. To compare power measurements taken at different times or places,
it is necessary to compensate for differing atmospheric conditions.
Correction Factors are used to
compensate engine horsepower measurements for differences in operating
conditions during engine testing. The typical correction factor (CF) is
calculated based on the absolute barometric pressure, air temperature and water
content of the air used for combustion by the engine under test. It attempts to
predict the horsepower that would be developed if the engine were tested at sea
level under standard pressure and temperature conditions.
Absolute barometric pressure is a
measure of how hard the air molecules are being pushed closer to one another.
The unit of measurement is typically inches of mercury (inches Hg). The more
pressure, the more molecules there are in a liter of air and the more air the
engine gobbles up during the intake stroke. Absolute barometric pressure is
equal to Relative barometric pressure only at sea level. Relative barometric
pressure is reported at airports and by weather barometers. A good approximation
for converting relative barometric pressure to absolute barometric pressure is:
AbsHg = RelHg - (Elev/1000)
Where:
AbsHg = Absolute
barometric pressure
RelHg = Relative
barometric pressure
Elev = test
location elevation in feet above sea level
Water content is calculated from the
ambient wet and dry bulb temperatures. Dry bulb temperature is normal room
temperature. Wet bulb temperature is always less than or equal to dry bulb
temperature. As air is blown over the wet bulb thermometer the water evaporates
and cools the thermometer. The dryer the air, the cooler the wet thermometer
indicates. If the ambient air is saturated (humidity = 100%), very little water
evaporates and the wet bulb temperature is equal to the dry bulb temperature.
These measurements are then converted to partial pressure in inches of mercury
and used in the correction formula. Water vapor displaces oxygen and reduces the
amount of combustion air ingested during the intake stroke.
Air temperature is the temperature of
the air entering the intake system of the engine under test. In some cases this
is ambient air temperature, but in other cases the intake air is significantly
heated by the engine and is different than ambient air. Heat tends to spread air
molecules apart. So as temperature increases, there are less molecules in a
liter of air and less air is swallowed during the intake stroke.
Dynojet’s WinPEP (Performance
Evaluation Program for Windows 95) software uses the SAE’s latest correction
formula (June 1990). This formula assumes a mechanical efficiency of 85% and is
much more accurate than earlier formulas at extreme conditions. The formula used
is:
CF= 1.18 x (29.22/Bdo) x To+460 / 537)
- 0.18
Where:
Bdo = Dry
ambient absolute barometric pressure
To = Intake
air temperature in degrees
F